
Figure 3.
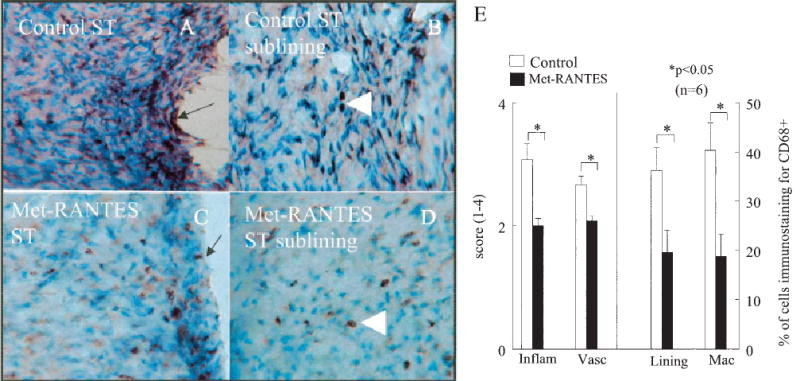
Decrease in CD68+ macrophage immunostaining in Met-RANTES–treated rats with adjuvant-induced arthritis (AIA) compared with control rats with AIA on day 18. Shown is staining of A, synovial tissue (ST) from a control rat, B, synovial tissue sublining from a control rat, C, synovial tissue from a Met-RANTES–treated rat, and D, synovial tissue sublining from a Met-RANTES–treated rat. Arrows indicate the lining cell layer; arrowheads indicate subsynovial macrophages. (Original magnification × 200 in A; × 400 in B–D.) E, Quantification of CD68+ immunoreactivity in synovial tissue from Met-RANTES–treated and control rats with AIA. Inflam = inflammation; vasc = vascularity; lining = synovial lining; Mac = macrophages. Values are the mean and SEM percentage of cells (n = 6 ankles per group).