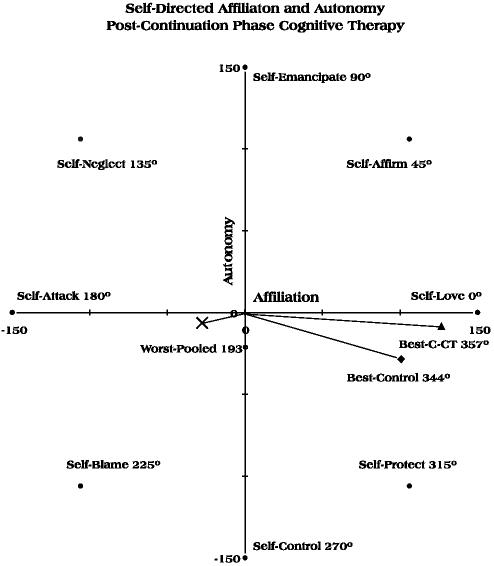
FIGURE 4.
Mean self-directed affiliation and autonomy scores from the Structural Analysis of Social Behavior after 8 months of continuation phase cognitive therapy (C–CT) or assessment only (Control). Worst ratings pooled because C–CT and control groups did not differ significantly. Best = ratings at one’s best; worst = ratings at one’s worst.

