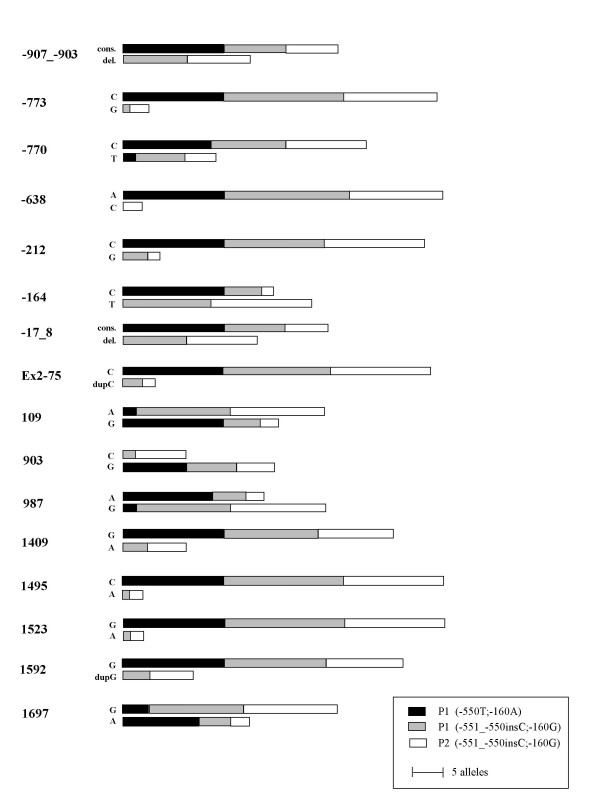
Figure 3.
The distribution of the polymorphic variants in the three different sample categories: P1(-550T;-160A), P1(-551_-550insC;-160G) and P2. The diagram shows data of 16 polymorphisms investigated. The data for the 5'- and the 3'-regions were obtained by sequencing while most of the data for exon 3 originated from PCR-ASP analysis. Eight, P1(-550T;-160A), ten P1(-551_-550insC;-160G) and nine P2 samples were investigated. However, for the 903C>G polymorphism the corresponding numbers were five, five and seven samples. In position -107_-106 all investigated samples had three guanosines instead of two as reported in the reference sequence (AL049757). We therefore do not consider this position as polymorphic in our analysis and it is consequently not included in this figure. cons. = consensus.

