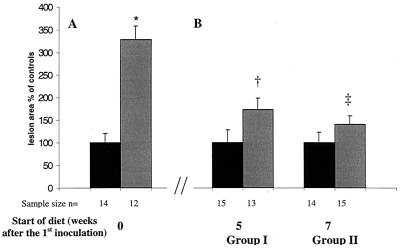
FIG. 2.
Shown are the sizes of fatty streaks in the aortic sinus when the high-fat/high-cholesterol diet was started simultaneously with infection (A) in comparison to when the high-fat/high-cholesterol diet was given after the infection (B). (Panel A is reprinted from reference 2 with permission of the publisher.) Average lesion area of infected mice (grey bars) was normalized to that of control mice (black bars = 100%). Bar graphs indicate means ± standard error of the mean. (∗, P = 0.015 versus control; †, P = 0.15 versus control; ‡, P = 0.22 versus control).

