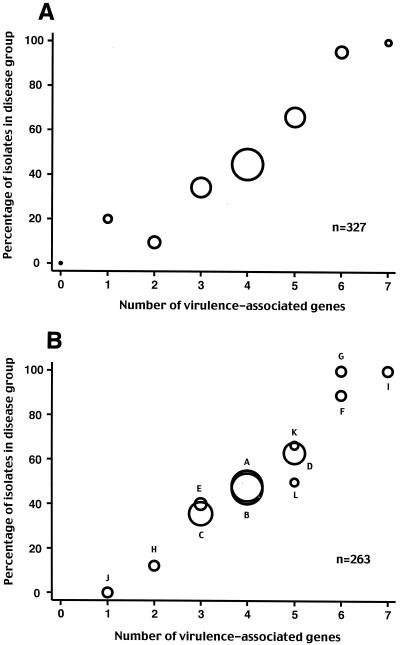
FIG. 2.
(A) Association between the number of virulence-associated determinants and the proportion of isolates from cases of disease (rather than carriage). For example, 20% of isolates with one virulence-associated gene were from cases of disease and 80% were carriage strains. The area of each circle is proportional to the number of isolates with that number of determinants (ranging from zero genes to seven genes, with n = 2, 15, 21, 64, 140, 56, 22, and 7, respectively). (B) Association between the number of virulence-associated determinants in a gene combination and the proportion of isolates with that combination from cases of disease (rather than carriage). Each combination is identified by a letter; for the actual gene complement, refer to Table 4. The 12 most common combinations representing 80% of isolates are shown. The area of each circle is proportional to the number of isolates in that gene combination (n for each gene combination is given in Table 4).

