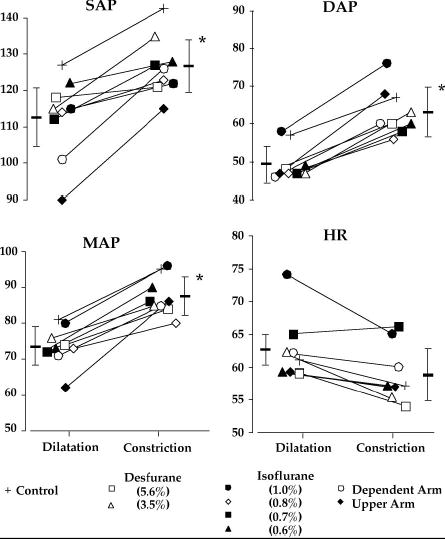
Fig. 1.

Systolic arterial pressure (SAP), diastolic arterial pressure (DAP), mean arterial pressure (MAP), and heart rate (HR) before and after vasoconstriction. Each symbol represents one group of study subjects. Data are represented as means of the individual studies, with the average and standard deviations for the entire study population also shown. Asterisks (*) identify statistically significant differences from vasodilatation (P < 0.001). See Table 2 for statistical analysis and detailed information.
