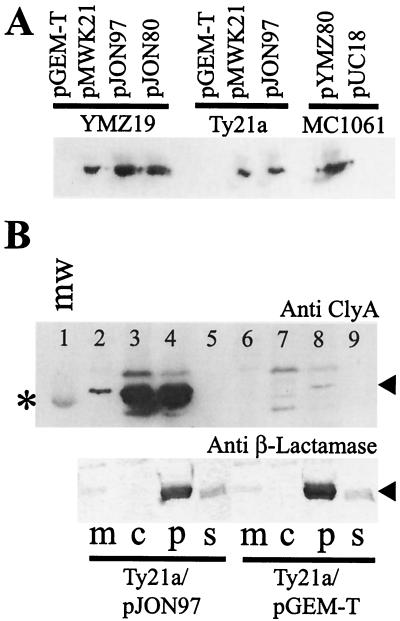
FIG. 3.
Expression of cloned serovar Typhi, serovar Paratyphi A, and E. coli ClyA determinants and subcellular localization of ClyASTy in serovar Typhi. Immunoreactive bands were visualized using the ECL+ blotting detection system (see Materials and Methods). (A) Immunoblot analysis, using a monoclonal ClyAEC antibody (final dilution, 1:5,000), of expression of cloned clyASTy (constructs pJON97 and pMWK21), clyASPa (construct pJON80), and clyAEC (construct pYMZ80) gene loci in E. coli YMZ19 (clyA::kan) and MC1061 (clyA+) and serovar Typhi Ty21a. Approximately 5 × 10⁷ cells of each strain were used for the extracts applied on the gel. (B) Subcellular fractionation of serovar Typhi Ty21a/pJON97 (lanes 2 to 5) and Ty21a/pGEM-T Easy (lanes 6 to 9) in membrane (m), cytosolic (c), periplasmic (p), and supernatant (s) fractions. Above, immunoblot analysis using a monoclonal antibody raised against ClyAEC (final dilution 1:5,000) is shown. The position of the band corresponding to the 30-kDa protein of the molecular-mass marker (mw; lane 1) is indicated by an asterisk, and the position of the immunoreactive band representing the ClyA protein is indicated by an arrowhead. Below, immunoblot analysis of the same subcellular fractions (corresponding to lanes 2 to 9 in the upper blot) using a polyclonal antiserum against β-lactamase is shown. The position of the immunoreactive band representing β-lactamase is indicated by an arrowhead. An amount of the subcellular fraction equal to approximately 3 μg of protein was applied in each lane of the gel.

