
Figure 3. Actinomycin D-chase assay for LO mRNA stabilities in control and CSC-treated cells.
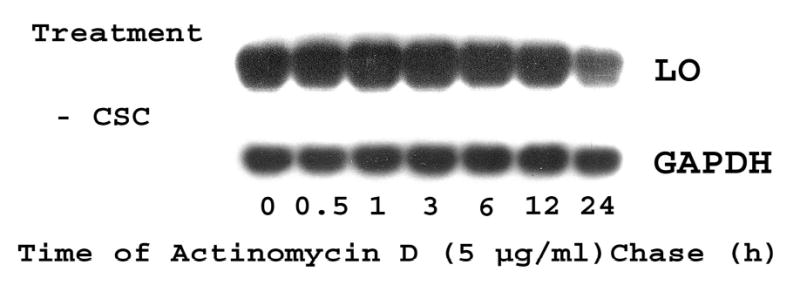
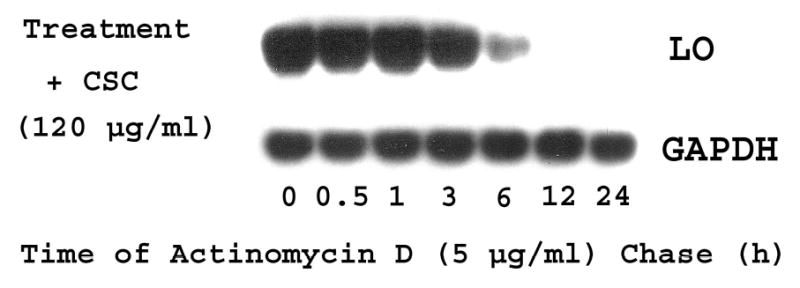
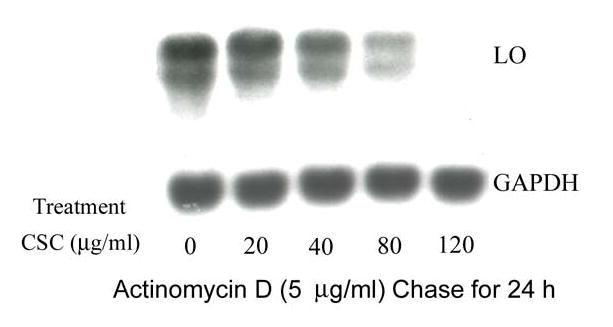
For time course studies, growth-arrested cells were incubated in the presence of 5 μg/ml of actinomycin D without (Panel A) or with CSC at 120 μg/ml (Panel B). At indicated time points, total RNA (15 μg) was extracted from each sample and analyzed by Northern blot. LO transcript levels were quantitated by the 1D Scan EX software and normalized to the internal control (GAPDH) using the level at zero time of actinomycin D treatment as 100%. For dose-response assays (Panel C), cells were incubated for 24 h with 5 μg/ml of actinomycin D in the absence (control) or presence of CSC at various doses. mRNA levels in control and treated cells were measured as described above and expressed as % of the control.