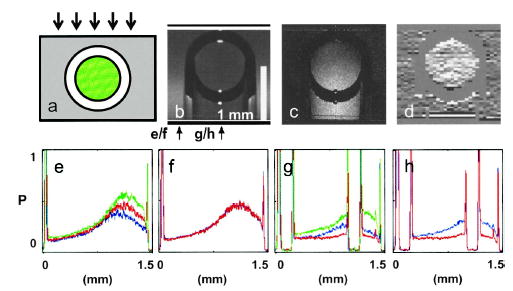
Fig. 2.

a, Cross section of the target sample; the arrows indicate probe light direction, green represents the location of the ICG and the scattering medium, and the surrounding gray region represents the scattering medium. b, OCT image at 795 nm (average of 300 scans); the arrows locate line traces for Figs. 1(e)–1(h). The imaging focal plane is near the bottom of the capillary tube. c, Contrast image created by using the image processing method described in Eq. (2). d, Unwrapped contrast image based on processing described in Eq. (3). e and g, OCT A-scans at different wavelengths (green, 760 nm; red, 795 nm; blue, 830 nm). f and g, Processed scans corresponding to the numerator (blue) and the denominator (red) of Eq. (2). The vertical scales for e–h are normalized to unity.
