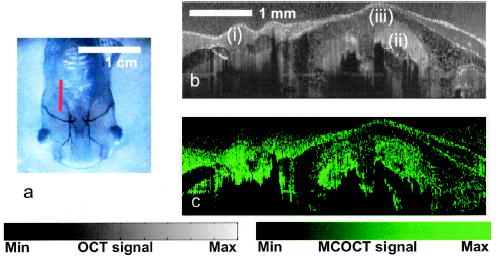
Fig. 3.

a, Ventral view of a stage 54 Xenopus laevis tadpole; the red line indicates the location where images are acquired. b, OCT image of the illuminated regions: (i) parabranchial cavity, (ii) gill arches, (iii) opercular field. (c) Spectral triangulation MCOCT contrast image of the same region.
