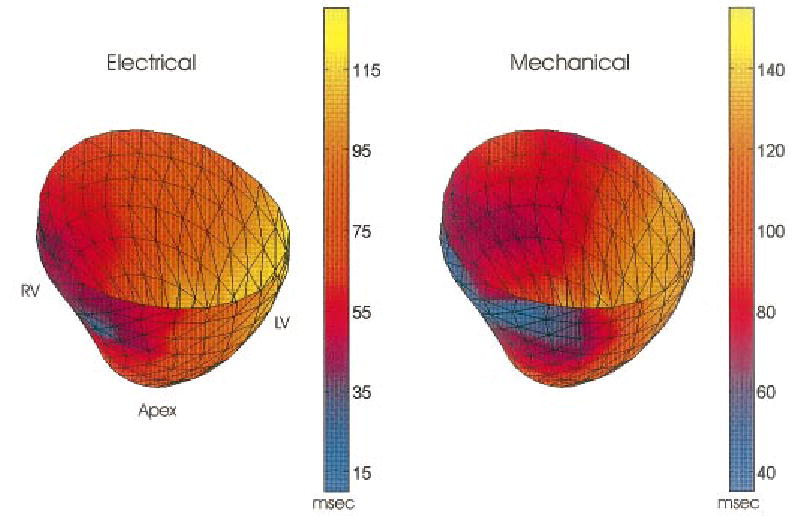
FIGURE 8.

Representative electrical and mechanical activation time maps temporally referenced to pacing stimulus. Maps show early activation near the RV pacing site with a smooth progression toward the late activated LV free wall. Patterns of electrical and mechanical activation are nearly identical with a temporal offset of ~25 ms.
