
Figure 8.
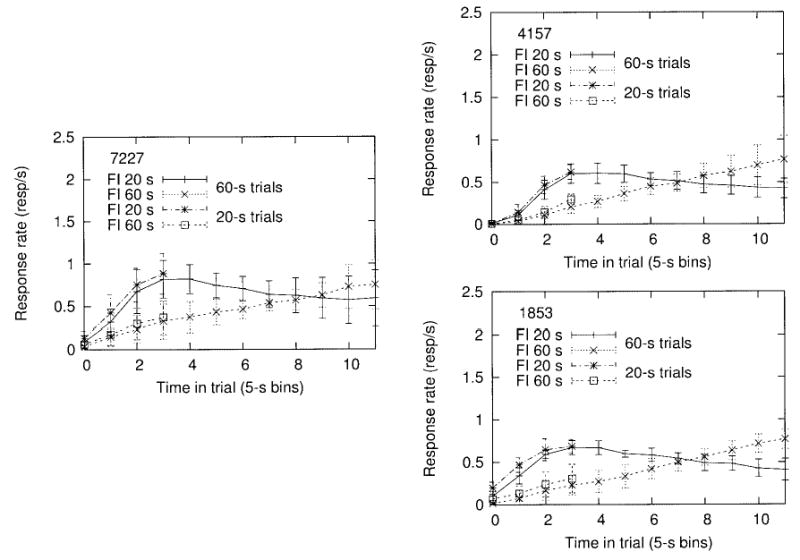
Response rate on the FI 20-s and FI 60-s schedules for individual pigeons in the replication of Experiment 2, with the 15-s intertrial blackout omitted. Rates are plotted as a function of the time elapsed since the beginning of a trial. Twenty-second trials (terminating with a reinforcer on the FI 20-s schedule) and 60-s trials (terminating with a reinforcer on the FI 60-s schedules) are shown separately. Data are averages from the last three sessions before a reversal, averaged over reversals; error bars are standard deviations. resp/s = responses per second; FI = fixed interval.