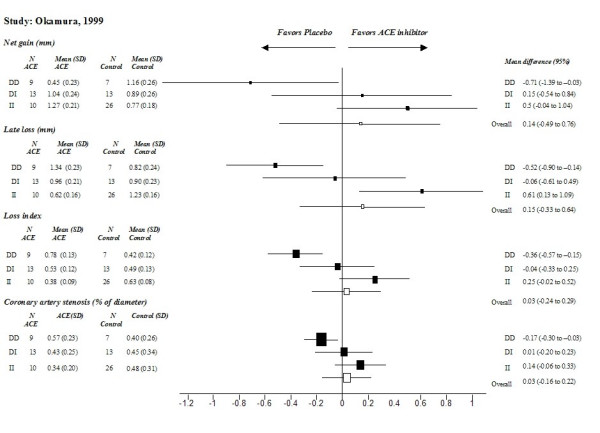
Figure 3.

Comparison of treatment effects between genotypes in Asians (results of the study of Okamura [21] on differences in minimal luminal diameter). Effects for each genotype (DD/DI/II) and the overall treatment effect are presented as mean differences (from follow-up to baseline) with 95% confidence intervals.
