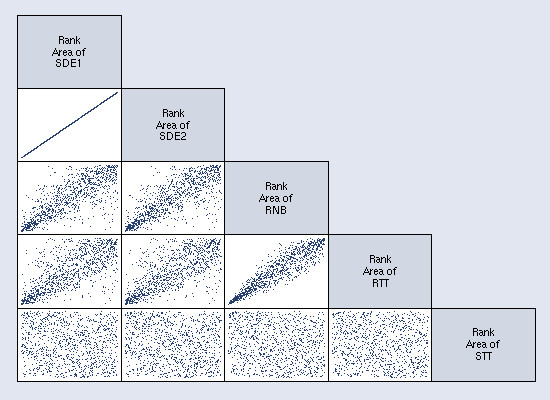
Figure 5.

Scatterplot matrix of rank-transformed areas of the five activity space measures. Visual representation of the correlation matrix showing the Spearman's rank correlations between area measures. The matrix shows the perfect correlation between the SDE1 and SDE2, the strong correlation between RNB and RTT, and the lack of correlation between the STT and the other measures.
