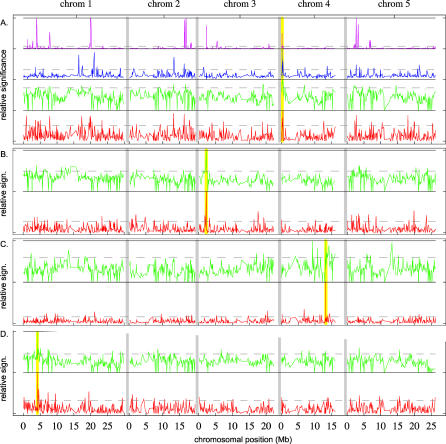
Figure 3. Genome-Wide Scans for Association with Flowering Time and Pathogen Resistance.
For flowering time (A), four different statistical methods were used (described in Materials and Methods): Voronoi focusing on “late” alleles (magenta line), Voronoi focusing on “early” alleles (blue line), CLASS (green line), and fragment-based Kruskal–Wallis tests (red line; see also Figure 2). For pathogen resistance (avrRpm1 [B], avrRpt2 [C], and avrPph3 [D]), only the last two tests were used. Higher peaks indicate stronger association (the y-axes are proportional to the negative log p-values, but have been normalized to the highest value within each test). The dotted lines correspond to the 95% percentile and are mainly intended to facilitate comparison between figures. Yellow vertical lines indicate the positions of the appropriate candidate loci. Peaks occur at these loci for all methods, but are otherwise distributed throughout the genome.

