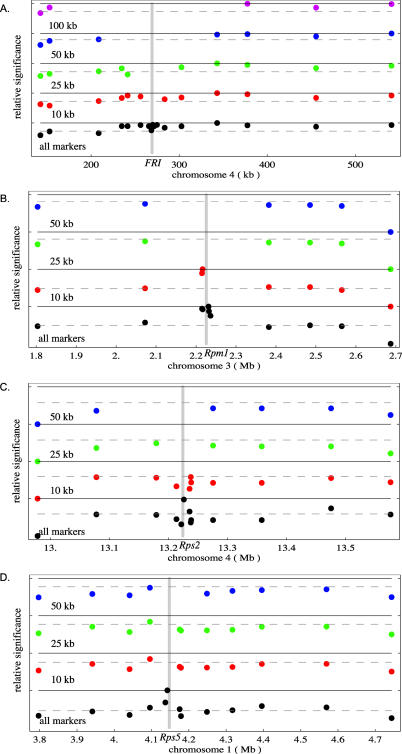
Figure 5. The Strength of Association (Using CLASS) around the Four Candidate Loci for Various Marker Densities.
For each locus (FRI [A], Rpm1 [B], Rps2 [C], and Rps5 [D]), the bottom panel shows the pattern of association using all available fragment markers around the locus (the position of which is given by a grey vertical line), and the panels above show the effect of successively reducing the marker density so that no markers are within 10, 25, 50, and 100 kb (FRI only) of the causative polymorphisms. The dotted grey line represents the 95th percentile of all associations across the genome. Because we used an association statistic that utilizes the pattern of haplotype sharing across multiple fragments, the relative significance of any particular fragment may change depending on the presence or absence of other fragments. The FRI region (A) remains strongly associated with flowering time even for the lowest marker density, while the signal of association around the R genes (B–D) disappears as one goes from 10- to 25-kb spacing.

