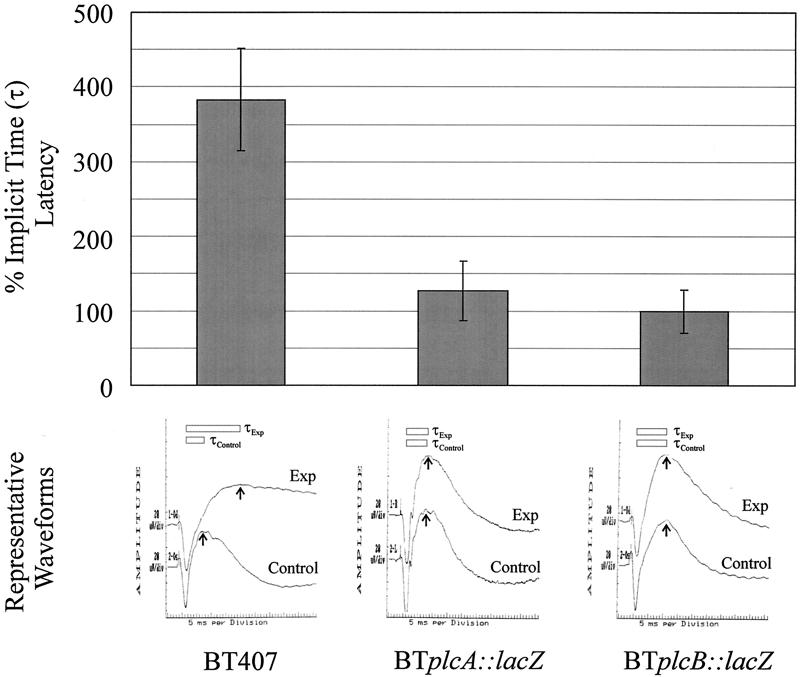
FIG. 6.
Analysis of latent b-wave responses in experimental B. thuringiensis endophthalmitis. The percent implicit time (τ) from a-wave valleys to b-wave peaks and representative waveforms from eyes intravitreally injected with strains BT407, BTplcA::lacZ, and BTplcB::lacZ at 6 h postinfection are shown. All values represent the mean and SEM for at least four eyes per group.

