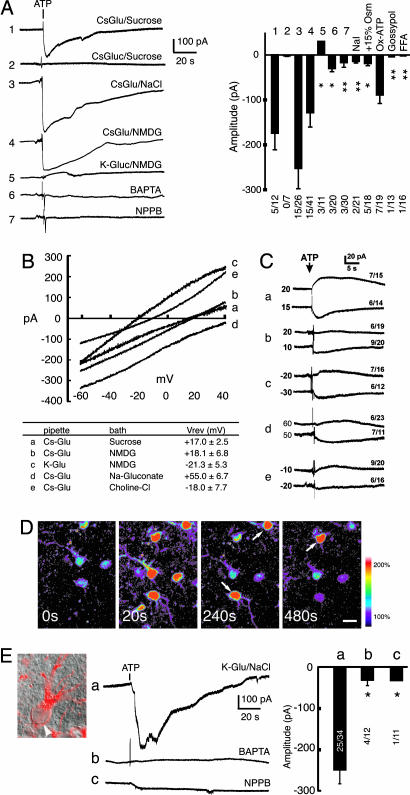
Fig. 4.
Astrocytic Ca2+ increases are associated with activation of a glutamate-permeable channel. (A Left) ATP induced an inward current in cultured astrocytes. Astrocytes were patched in the whole-cell voltage-clamp configuration with a holding potential of -60 mV. Continuous recording with 123 mM Cs-glutamate in the pipette and 250 mM sucrose in the extracellular solution showed that ATP evoked an inward current (1). When Cs-gluconate replaced intracellular Cs-glutamate and sucrose in extracellular solution, no currents were induced by ATP (2). When sucrose was replaced with 126 mM NaCl in the bath, the amplitude of the inward current increased (3). When 126 mM NMDG-Cl replaced sucrose, a similar inward current was induced by ATP (4). When K-gluconate replaced intracellular Cs-glutamate, a small outward current was recorded (5). The addition of 10 mM BAPTA in the pipette (same conditions as in 3) inhibited the inward current (6). When 100 μM NPPB was added to the bath (same conditions as in 3), the inward current was inhibited (7). (A Right) Mean amplitude of ATP-induced currents. Replacing Cl- with I- (NaI) potently inhibited the inward current. Increasing the bath osmolarity by 15% (+15% Osm) by adding sucrose to the bath solution attenuated the ATP-induced current, whereas OxATP (300 μM for 1 h) was without effect. The ATP-induced current was inhibited by gossypol (10 μM) and FFA (100 μM). *, P < 0.05 and **, P < 0.01 compared with (1). The numbers indicate responding cells/total cells in each experiment. (B Upper) The ramp I-V currents (ATP-induced net currents) with [CsGlu]in/[sucrose]out (a), [CsGlu]in/[NMDG]out (b), [KGlu]in/[NMDG]out (c), [CsGlu]in/[NaGluconate]out (d), [CsGlu]in/[CholineCl]out (e). (B Lower) Summary table of the reversal potentials (mean ± SEM in mV). (C) Measurements of reversal potential by using steady-state holding potentials in the same conditions as in B (a-e labeling as in B). The numbers to the left side of each trace show the holding potential, whereas the numbers on the right show the number of responding cells/the total number of tested cells. (D) ATP-induced Ca2+ increases in astrocytes in hippocampal slices (P14). Ca2+ normalized within 1 or 2 min, but some cells continued to display oscillatory increases in Ca2+ (white arrows). (Scale bar: 10 μm.) (E) ATP-evoked inward currents in astrocytes in hippocampal slices. (Right) Astrocytes in hippocampus (stratum radiatum) were identified under DIC optics by their small cell bodies (white arrowhead), which stained positive for GFAP (red), and by their high resting membrane potential, and absence of depolarization-evoked action potential. (Middle) Representative recordings of ATP-induced currents. (a) 50 mM K-glutamate/73 mM K-gluconate in the pipette and 126 mM NaCl in the bath. (b) 10 mM BAPTA in the pipette with the same solutions as in a.(c) NPPB (100 μM) was added to the bath. Tetrodotoxin (1 μM) was present in the bath. (Left) Summary histogram showing the mean amplitude of the ATP-induced currents with the number of responding cells/the total number of tested cells. *, P < 0.05 compared to a. Mean ± SEM.

