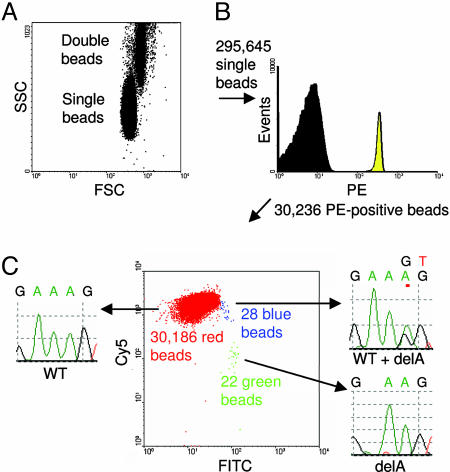
Fig. 3.
Processing of flow cytometry data obtained by BEAMing. (A) Dot plot of forward-scatter (FSC) and side-scatter (SSC) signals of beads. (B) Histogram of single beads with regard to PE signal. (C) Dot plot showing the Cy5 and FITC fluorescence intensity profiles of PE-positive beads. The beads clustered in three distinct populations colored red, green, and blue. Sequencing of individual beads sorted from each population showed that the red and green beads contained homogeneous WT and mutant sequences, respectively; the blue beads contained a mixture of WT and mutant sequences.

