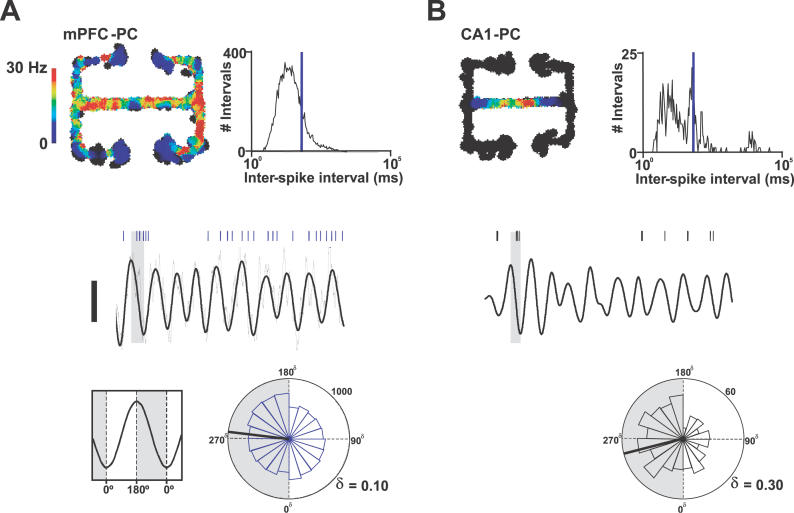
Figure 5. Spike-Timing in CA1 and mPFC Populations Was Phase-Locked to CA1 Theta Rhythm.
Firing-rate maps for representative mPFC (A) and CA1 (B) pyramidal cells. Graphs show inter-spike interval distributions (blue line marks 10 Hz). Thick black lines show CA1 LFP band pass filtered at 4–12 Hz during single central-arm crossings (scale bar 0.5 mV, length 1.3 s and 1.4 s in A and B, respectively) with spike times of the two neurons above marked by ticks. Raw LFP is shown by the thin black line in A. Rose histograms show phase distributions for these single mPFC (blue) and CA1 (black) neurons with respect to CA1 theta rhythm. Thick black lines mark mean preferred phase. The numbers on the outer circular axis give spike counts. Circular-concentration coefficients are given by κ. Both distributions are significantly nonuniform (p < 0.01, Rayleigh test).

