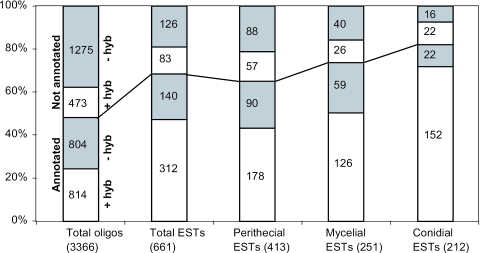
Figure 3.
Proportion of genes that yielded mRNA profiles and annotation status of genes to which oligomers were designed and synthesized. From the left, bars are for total genes, all of the predicted genes with EST matches, genes with perithecial EST matches, genes with mycelial EST matches and genes with conidial EST matches. The total number of predicted genes in each category is shown in parentheses. Below the line indicates annotated genes with (open box) or without (shaded box) mRNA profiles. Above the line indicates unannotated genes with (open box) or without (shaded box) mRNA profiles. Number of corresponding genes is shown for each area.

