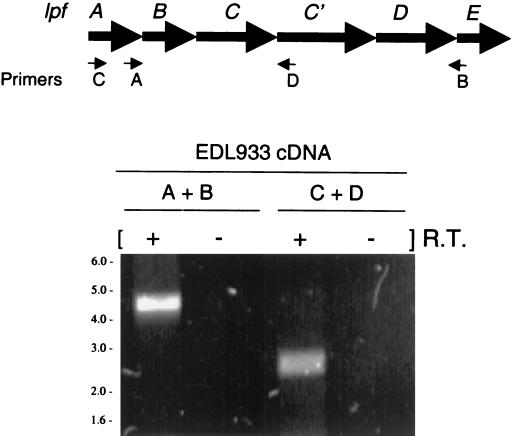
FIG. 2.
RT-PCR analysis. RNA was extracted from EHEC EDL933 and subjected to RT-PCR amplification. The locations of the primer pairs (A+B and C+D) used in the RT-PCR analysis are indicated in the schematic lpf operon. The presence (+) or absence (−) of RT in the reaction is indicated. PCR products were not visualized in the control lanes (−). The sizes (in kilobases) and positions of DNA markers are indicated on the left.

