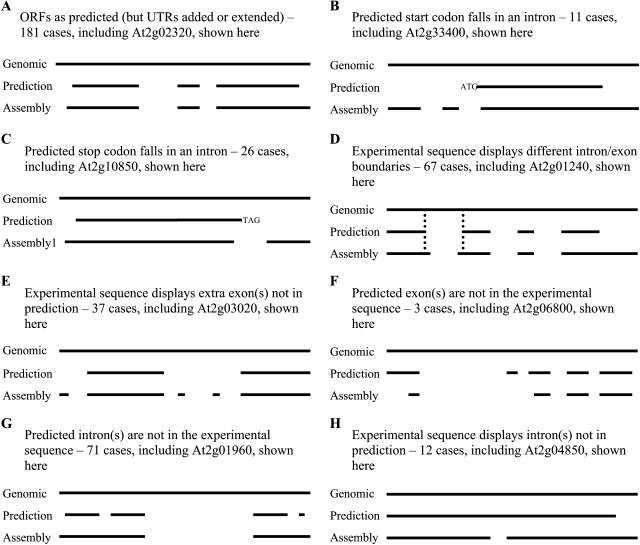
Figure 2.
Examples of comparison of experimentally derived cDNA sequences to the predictions. A to H, Different types of relationships between the predicted gene structure (identified by AGI identifier: At2g#####) and that inferred from RACE sequence (Assembly). The continuous upper line indicates the uninterrupted genomic sequence, the second line the spliced alignment of the predicted hypothetical gene model to the genomic sequence, and subsequent lines the spliced alignments of RACE-derived sequence. Vertical dotted lines highlight differences in splice site locations. All the predicted gene structures are annotation Version 1. The GenBank accession numbers are At2g02320 assembly, AY168990; At2g33400 assembly, AY144106; At2g10850 assembly, AY501348; At2g01240 assembly, AY500325; At2g03020 assembly, AY219083; At2g06800 assembly, AY464642; At2g01960 assembly, AY168991; and At2g04850 assembly, DQ069802.

