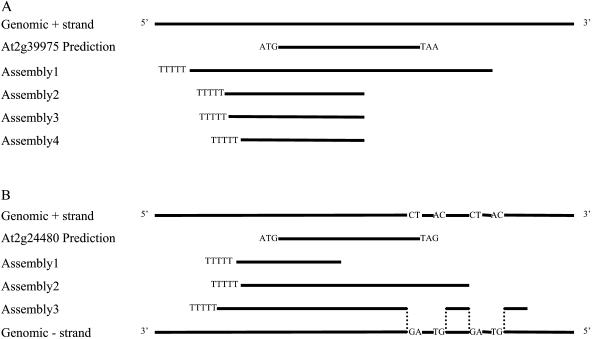
Figure 4.
Examples of transcripts from strands opposite to the original prediction. Solid lines are genomic sequences in genomic strands or exon sequences in prediction and assemblies. Dotted lines show the alignment of intron/exon boundaries. Splice site, GT-AG or CT-AC, is shown in genomic strands. Poly(T) tails are shown as TTTTT in assemblies. Start and stop codons are shown in predicted CDS. The predicted gene structures are annotation Version 1. None of the opposite-strand transcripts shown here has a good ORF. The GenBank accession numbers are transcript on the opposite strand of At2g39975 (assembly1), DQ069850; transcript on the opposite strand of At2g24480 (assembly2), DQ069848; and transcript on the opposite strand of At2g24480 (assembly3), DQ069849.

