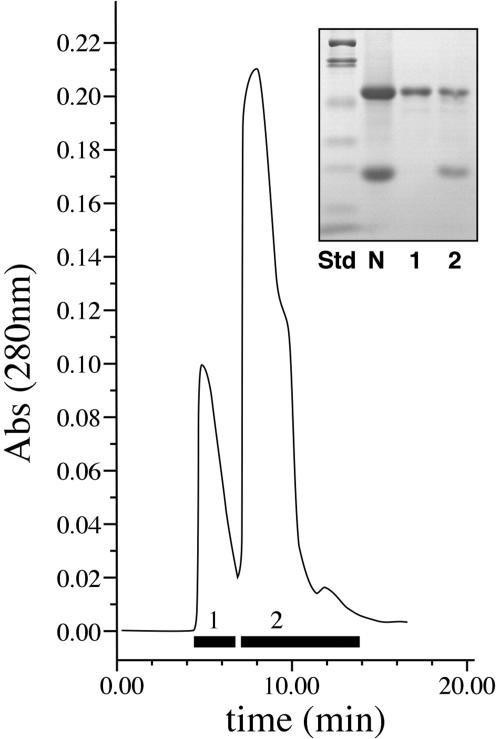
Figure 4.
HPLC purification of NEC4. Fractions that were pooled are shown by the bars at the bottom of the partial column profile. The inset shows an SDS-PAGE profile: lane 1, protein standards (myosin, 200 kD; β-galactosidase, 116 kD; phosphorylase b, 97 kD; bovine serum albumin, 66 kD; ovalbumen, 45 kD; carbonic anhydrase, 31 kD; soybean trypsin inhibitor, 21.5 kD; and lysozyme, 14.4 kD); lane 2, raw nectar; lane 3, proteins from pool 1; lane 4, proteins from pool 2.

