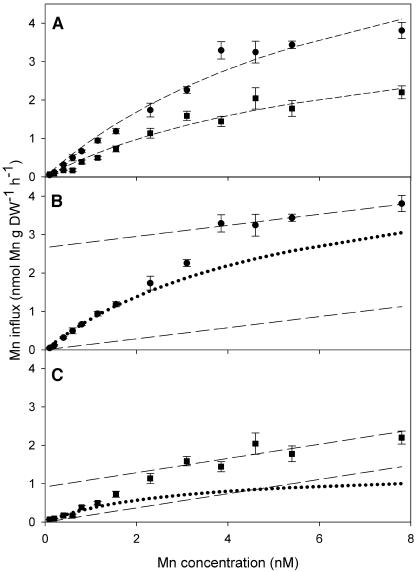
Figure 3.
A, Concentration-dependent kinetics for high-affinity 54Mn2+ influx in 10-d-old plants of the Mn-efficient barley genotype Vanessa (circle) and the Mn-inefficient barley genotype Antonia (square) at low Mn concentrations (0.1–7.8 nm). The data were fitted to the Michaelis-Menten equation by nonlinear regression (dashed line). B and C, Calculated saturable uptake kinetics from Vanessa and Antonia, respectively, obtained as follows: The linear (dashed line) and saturable (dotted curve) components were derived from the experimental data (circles or squares) by first computing the linear component of the regression line (dashed) plotted through high-concentration points and subsequently subtracting this contribution from the experimental data in order to obtain the saturable influx component by nonlinear Michaelis-Menten regression analysis. The kinetics was estimated using the Michaelis-Menten equation (dotted curves). Error bars represent means (n = 4) ± se.

