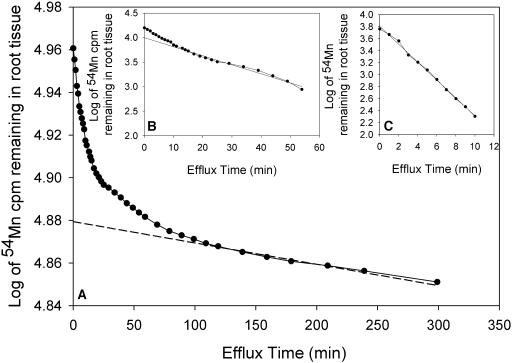
Figure 6.
Time course of Mn efflux from 13-d-old barley roots (genotype Vanessa) preloaded with 54Mn. The remaining 54Mn in the root tissue was calculated and plotted against time. The regression lines were drawn through the linear part of the curve and extrapolated to a given value at time zero. The extrapolation to time zero in A represents the size of the vacuolar Mn pool. Subtraction of the linear component from the data points in A produced the curve in B, which linear part represents the cytoplasmic Mn pool. A similar procedure was used to obtain the value in C representing the cell-wall-bound Mn pool. The mean values of five independent regression estimates similar to the one outlined above are listed in Table I. R2 values for A and B were always >0.99 and for C >0.93.

