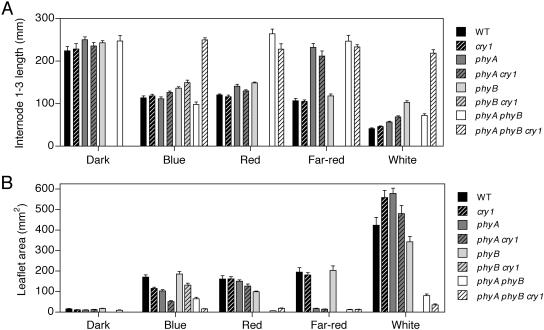
Figure 5.
Interaction of phyA, phyB, and cry1 in pea seedling de-etiolation. Internode length (A) and leaflet area (B) estimated as length × width of the larger leaflet from leaf 3 for seedlings grown in complete darkness or under continuous blue (20 μmol m−2 s−1), red (20 μmol m−2 s−1), far-red (20 μmol m−2 s−1), or white light (110 μmol m−2 s−1). Values represent means ± se, n = 8 to 12.

