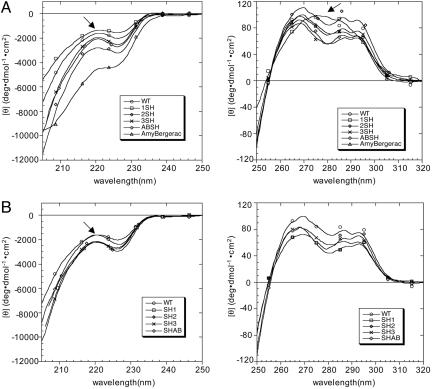
Fig. 2.
Far-UV (Left) and near-UV (Right) CD spectra recorded for the α-SH3 with insertions at the N terminus and distal loop (A) and the C terminus (B). Spectra have been recorded at t = 0, pH 2.6, and c ≈ 300 μM, except for 2-SH and AmyBergerac (t = 0, pH 2.6, and c ≈ 100 μM). The spectrum of the WT protein is displayed as a reference. Arrows in the far-UV CD plots indicate the inflexion point at 221 nm. The arrow in the near-UV CD plot (A Right) indicates the new peak at 280 nm exhibited by 1-SH.

