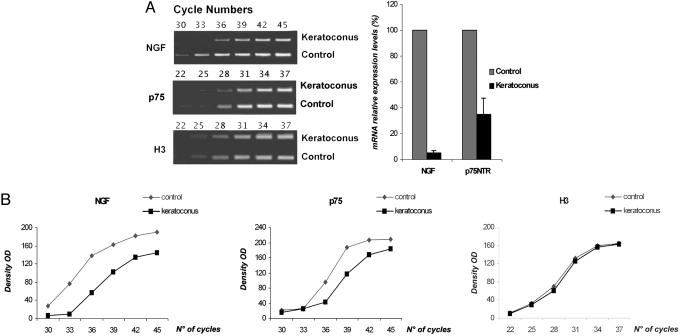
Fig. 2.
Decrease of NGF and p75NTR mRNA expression in keratoconus. (A) (Left) Semiquantitative RT-PCRs were run on ethidium-bromide-stained agarose gels. To identify the logarithmic phase of amplification for all genes, two sets of step-cycle PCRs were carried out. The first set was in a range of 22-37 cycles and revealed that H3 and p75NTR genes were within the linear dynamic range of amplification after 31 cycles. The second set was in a range of 30-45 cycles and revealed that NGF amplification was linear after 38 cycles. (Right) The histogram illustrates the percentage of mRNA relative expression for NGF and p75NTR. Means ± SD of three separate experiments are shown in the graph. (B) Cycle titration curves of RT-PCR amplification for the housekeeping gene H3, p75NTR, and NGF genes in keratoconus and control corneas.

