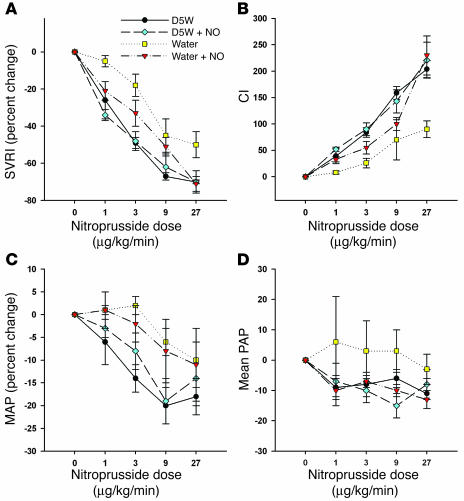
Figure 7.
Physiologic effects of sodium nitroprusside during hemolysis with and without inhaled NO. Percent change in SVRI (A) and CI (B) in response to increasing doses of sodium nitroprusside during the intervention studies for each of the 4 treatment groups. Compared with D5W and D5W plus NO, free water–induced hemolysis led to blunted hemodynamic effects of escalating doses of sodium nitroprusside, which were restored with inhaled NO therapy and oxidation of plasma Hb (P = 0.005 and P = 0.02 for SVRI and CI, respectively). Similar but not statistically significant patterns of response to increasing doses of sodium nitroprusside in the 4 treatment groups were also demonstrated for MAP (C), PAP (D), heart rate, CVP, and PCWP. In fact, all 7 hemodynamic variables demonstrated the expected ordered responses to nitroprusside (P = 0.008 for 7/7 variables having the same response pattern).

