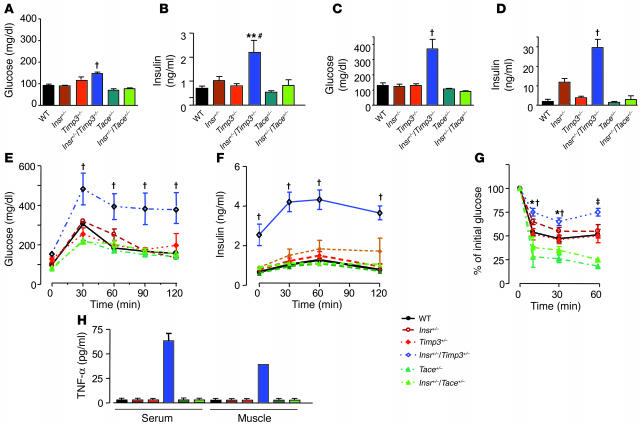
Figure 7.
Glucose homeostasis in Insr+/–Timp3+/–, Insr+/–Tace+/–, Insr+/–, Timp3+/–, Tace+/–, and WT littermates at 6 months. Fasted glucose (A), fasted insulin (B), fed glucose (C), and fed insulin (D) levels (n = 8–10 per group). Data are expressed mean ± SD. †P < 0.001 for Insr+/–/Timp3+/– versus other genotypes by 1-way ANOVA; **P < 0.01 for Insr+/–Timp3+/– versus Timp3+/–, Tace+/–, and WT; #P < 0.05, Insr+/–Timp3+/– versus Insr+/– and Insr+/–Tace+/– by 1-way ANOVA. Glucose (E) and insulin (F) levels during an intraperitoneal glucose tolerance test. Data are expressed as mean ± SD (n = 5 per group). †P < 0.001, Insr+/–Timp3+/– versus other genotypes by 2-way ANOVA. (G) Insulin tolerance test (0.75 U kg–1). Data are expressed as mean ± SD (n = 5 per group). †P < 0.001, Insr+/–Timp3+/– versus Timp3+/–, Tace+/–, and WT; *P < 0.05, Insr+/–/Timp3+/– versus Insr+/– and Insr+/–Tace+/– by 2-way ANOVA at 10 and 30 minutes; and ‡P < 0.001, Insr+/–Timp3+/– versus Insr+/–Tace+/–, Insr+/–, Timp3+/–, Tace+/–, and WT by 2-way ANOVA at 60 minutes. (H) Quantification of TNF-α in Insr+/–Timp3+/–, Insr+/–Tace+/–, Insr+/–, Timp3+/–, Tace+/–, and WT littermates.

