
Figure 3.
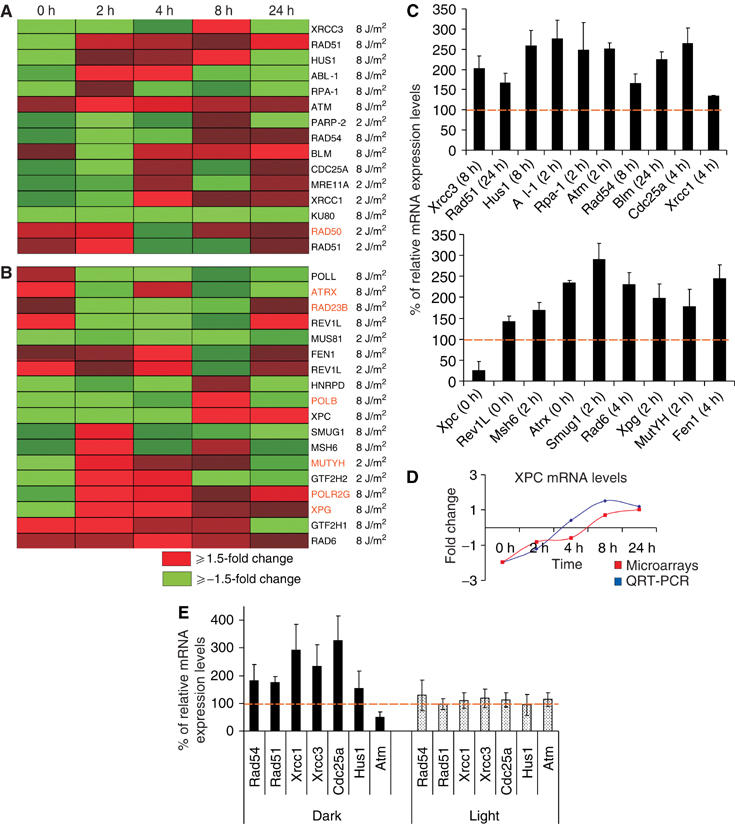
CPDs provoke the transcriptional response of genes associated with replication-dependent and -independent modes of DNA damage repair. (A) Heat map representation of time-dependent expression profiles of genes associated with SSB/DSB repair and signalling. (B) Additional modes of DNA repair in UV-irradiated, non-PR-treated MDFs as compared to non-UV, non-PR-treated MDFs. Changes in fold expression are represented by red (upregulated ⩾+1.5-fold change) and green (downregulated ⩾−1.5-fold change) as indicated. All other colors represent intermediate fold changes. Gene entries in orange represent those genes that displayed significant expression profiles upon removal of CPDs by PR. The 0 h time point includes the 1 h exposure to PR. (C) QRT-PCR verification of microarray data. Fold changes are expressed as percentage of relative mRNA expression for each gene in UV-irradiated (8 J/m2 of UV-C), non-PR-treated MDFs as compared to non-irradiated, non-PR-treated MDFs at the indicated time points. (D) Time-dependent mRNA expression levels of XPC obtained from microarrays and real-time PCR as indicated in UV-irradiated, non-PR-treated MDFs as compared to non-irradiated, non-PR-treated MDFs. Fold changes are expressed in log2 ratios. (E) QRT-PCR evaluation of genes associated with DSB repair and signalling in UV-irradiated, non-PR-treated mouse skin. Fold changes are expressed as percentage of the relative mRNA expression levels for each gene in the UV-irradiated, PR-treated mouse skin over the non-UV, non-PR-treated mouse skin 5 h after UV irradiation and subsequent PR treatment (3 h).