
Figure 8.
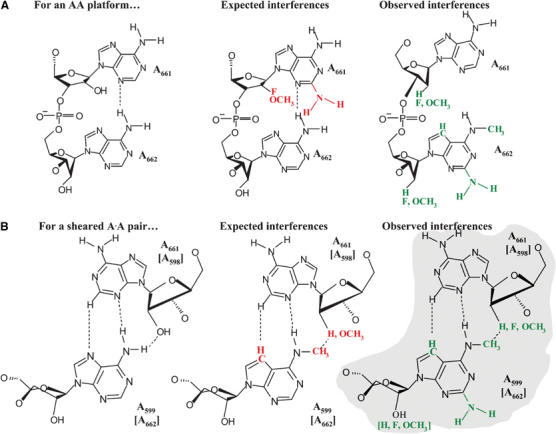
A correlation of the experimental NAIM data for D3 bulge nucleotides with the predicted NAIM pattern for the AA platform (A) and a trans-Hoogsteen–sugar edge A·A base pair (B). Predicted NAIM effects are shown in red, experimentally identified NAIM effects are shown in green. The structure that best fits the experimental data is indicated by light gray shading.