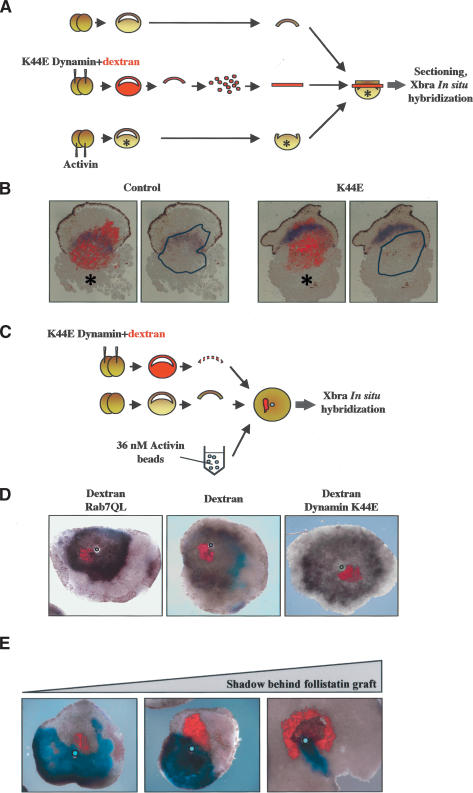
Figure 6.
Endocytic trafficking and formation of an activin gradient. (A) Three-dimensional analysis of extracellular activin propagation. A rhodamine-dextran or Dynamin K44E and rhodamine-dextran-expressing animal cap cell layer is sandwiched between the vegetal pole of an embryo overexpressing activin (marked by a star) and an uninjected animal cap. In this context, the activin secreted by the vegetal tissue has to cross the intermediate layer in order to reach and activate Xbra in the uninjected animal cap. After 3 h of incubation, sandwiches were fixed and sectioned. Propagation of activin throughout the tissue was then measured by Xbra in situ hybridization. The effect of Dynamin K44E overexpression was determined by RT–PCR analysis on a fraction of dissociated cells used for formation of the intermediate layer (not shown). (B) In situ hybridization of sections of sandwiches after the 3D test. Red fluorescence indicates the position of rhodamine-dextran-injected cells in the intermediate layer. The star indicates the position of the activin-secreting tissue. (Right) The position of the intermediate layer is marked by a black line to allow better visualization of Xbra in situ hybridization. (C) 2D analysis of extracellular activin propagation: A bead loaded with activin is used to mimic an activin source. This bead is grafted to the center of an animal cap from a stage 8 embryo. At the same time, a graft from the animal cap of an embryo injected with an mRNA of interest together with the lineage marker rhodamine-dextran is placed next to the bead. Propagation of activin is then measured by in situ hybridization for the activin-induced gene Brachyury.(D) Interfering with the intracellular route. The 2D test shown in C is used to monitor activin gradient formation through embryonic tissue with modified internalization pathways (Dynamin K44E, no internalization; Rab7QL, increased lysosomal trafficking). The picture shows in situ hybridization of animal caps after the 2D test. Red fluorescence indicates the position of rhodamine-dextran-injected cells. The light-blue circle shows the position of the activin bead. (E) Interfering with the extracellular route. The 2D test shown in C is used to monitor activin gradient formation through Follistatin-expressing embryonic tissue. From left to right are shown animal caps with increased areas devoid of Xbra expression distal to the Follistatin graft (red).

