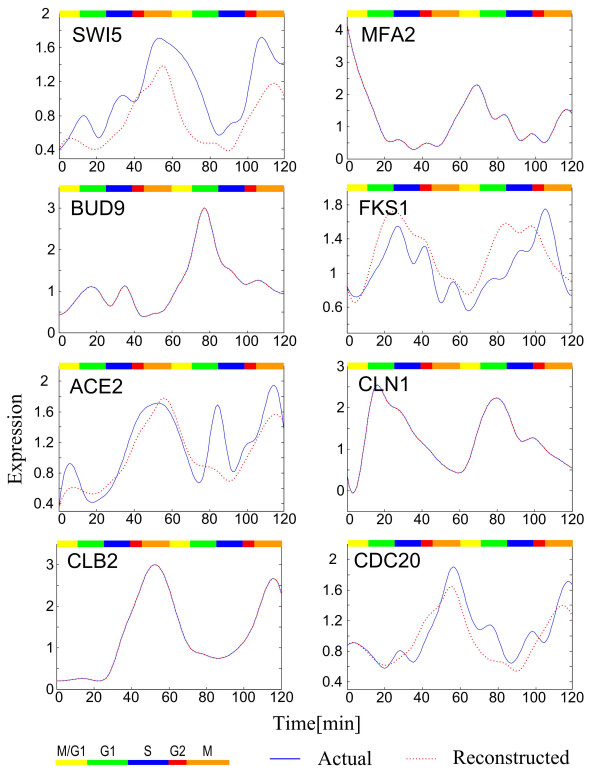
Figure 5.
Comparison between the actual gene expression profiles (with cubic spline) and the reconstructed gene expression profiles. The examples shown were randomly chosen. The reconstructed gene expression profiles were obtained by integrating the estimated cis-regulatory functions and the chromatin immunoprecipitation data. When there is only one blue line in a figure it means that the reconstructed function is very close to the actual gene expression profile. Different phases in the cell cycle are indicated by the colored bar.

