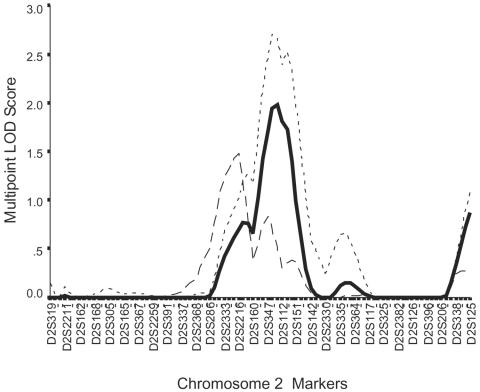
Figure 2.
More-detailed representation of the linkages observed on chromosome 2 from the initial genome scan. The solid line represents the main CAD phenotype; the long-dashed line represents the MI subphenotype; the short-dashed line represent the CAD phenotype for families with minimum age at onset of <56 years.

