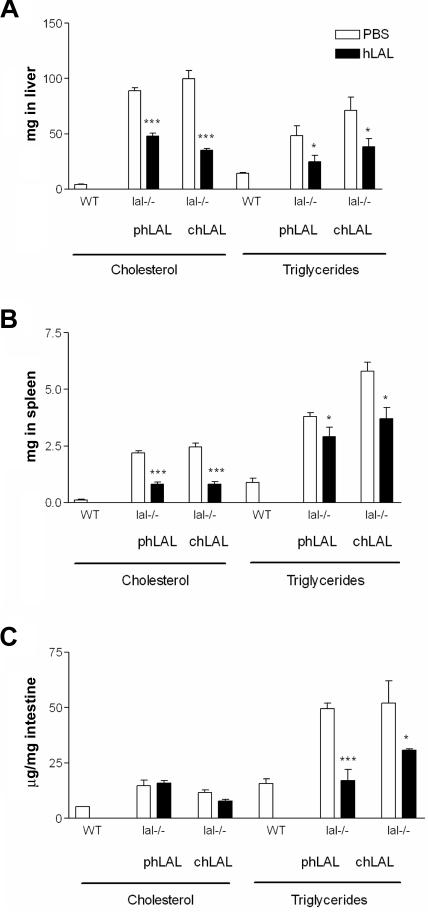
Figure 3.
Tissue cholesterol and TGs in lal−/− mice administered PBS or chLAL. Total cholesterol or total TGs per liver (A) or per spleen (B) and lipid concentration in intestine (C) was compared between PBS control mice and phLAL- or chLAL-injected mice (n=6). The P values were from unpaired t tests between PBS and chLAL-treated samples. *P<.05. ***P<.001. WT = wild type.

