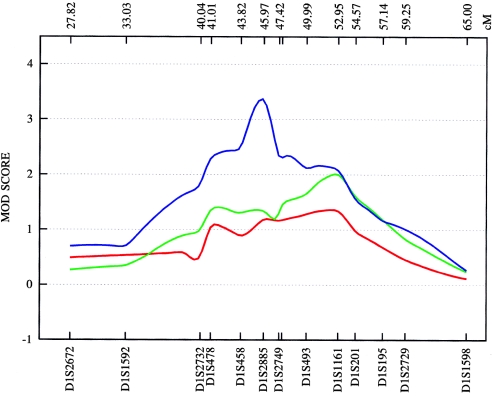
Figure 6.
Plot of the MOD score for chromosome 1p35-p36, with a separate maximization over trait-model parameters for each genetic position assumed for the trait locus. ASDI (red) position of the maximum MOD score: 52.34 cM; penetrances {0.00; 0.49; 0.49}; disease-allele frequency 0.050. ASDII (green) position of the maximum MOD score: 52.63 cM; penetrances {0.00; 0.50; 0.50}; disease-allele frequency 0.040. ASDIII (blue) position of the maximum MOD score: 45.95 cM; penetrances {0.00; 0.53; 0.53}; disease-allele frequency 0.160. MOD scores are determined from the deCODE Genetics sex-averaged map. The penetrance of the disease models is obtained by MOD-score analysis and given in order {f+/+; fm/+; fm/m}. A plus sign (+) indicates the wild-type allele; “m” indicates the mutant allele.

