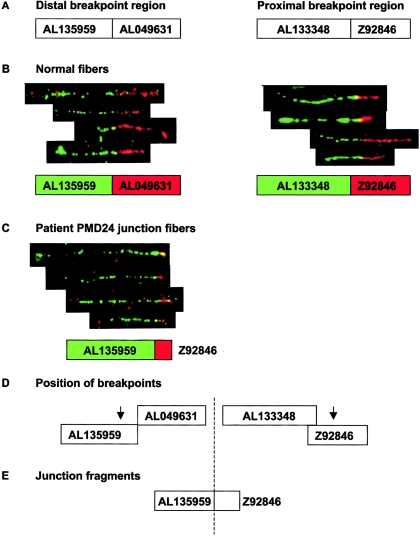
Figure 3.
Fiber FISH mapping of duplication breakpoints in patient PMD24. A, Relative sizes and positions of distal and proximal breakpoint clones used for fiber FISH, as shown in Ensembl. Interphase FISH had previously mapped the distal breakpoint within AL135959 and AL049631 and the proximal breakpoint within AL133348 and Z92846. B, Composite image of fiber FISH of normal cell lines, showing the relationship between distal and proximal breakpoint clones. Underneath each fiber FISH image is a representation of the relationship between these clones, as deduced from the fiber FISH data. The color of the box for each clone corresponds to the color in the FISH image. C, Fiber FISH of PMD24 fibers by use of the distal and proximal clones expected to contain the duplication breakpoint. Juxtaposed signals for AL135959 and Z92846 in the patient are shown. Signals for these clones were widely separated in normal controls and showed no relationship (data not shown). These clones are normally located ∼800 kb apart and clearly demonstrate that the duplication was tandem in nature. D, Arrows show the likely position of both breakpoints, on the basis of fiber FISH data. Since only a short red hybridization signal was observed in junction fibers as opposed to normal fibers, we estimated that the breakpoint is in the proximal half of clone Z92846. In contrast, the length of the green signal was almost the same in junction and normal fibers, suggesting that the breakpoint was toward the end of clone AL135959. E, Probable orientation of clones relative to the breakpoint (dashed line). The images shown are composites of several different fibers from the same experiment, but only four individual fibers are shown from each hybridization, for simplicity. The fibers shown are representative of the images captured from each slide.

