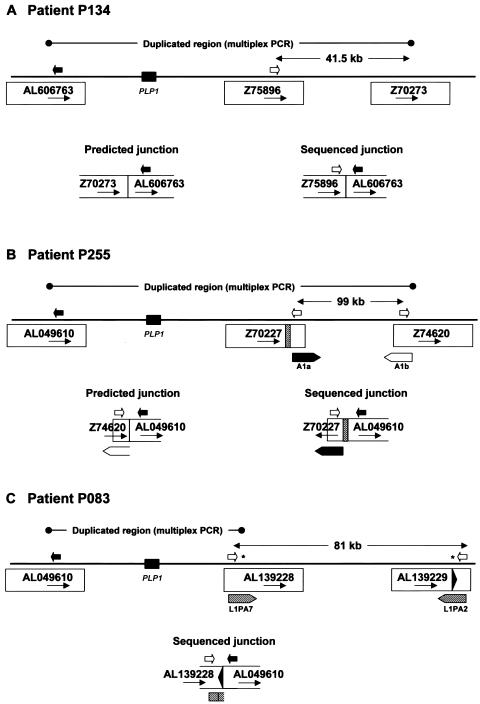
Figure 6.
Complex rearrangements in three patients. For each patient, the extent of duplication predicted by multiplex PCR is indicated by a line with circles at each end. The distance between the distal breakpoint predicted by multiplex PCR and the actual distal breakpoint identified by sequence analysis of the junction fragment (A and B) or the distance between two potential distal breakpoints (C) is indicated by a line with arrowheads at each end. The relative position of PLP1 is indicated by a black rectangle; potential breakpoint clones are indicated by accession number; the relative positions of PCR primers used in the analysis are indicated by arrows; and the junctions predicted by multiplex PCR and the actual sequenced junctions are diagrammed. A, Patient P134. B, Patient P255. The relative positions of the A1a and A1b repeats of the LCR (diagrammed in detail in fig. 7) are indicated by thick arrows. A unique region of clone Z70227 (254 bp) that is not present in Z74620 is indicated by a striped rectangle. C, Patient P083. Relative positions of LINEs are indicated by striped arrows, and potential positions of the distal breakpoint are indicated by an asterisk (*). The black arrowhead indicates a 55-bp region of clone AL139229. Not drawn to scale.

