Figure 7.
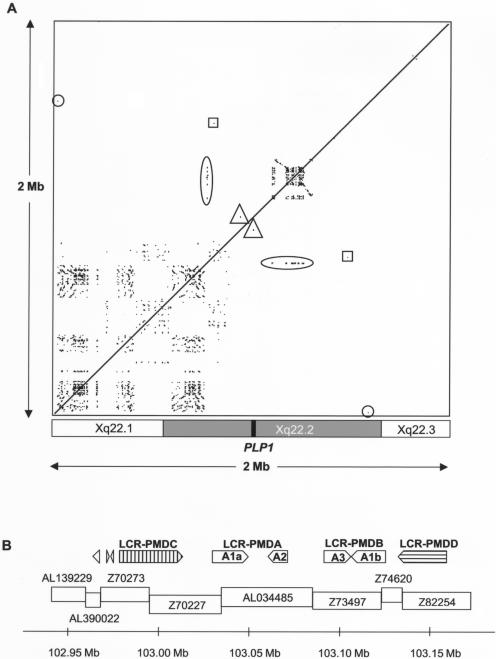
Analysis of repeats in the PLP1 genomic region. A, Region-specific repeats in the genomic region surrounding PLP1. A 2-Mb human genomic sequence was masked for interspersed repetitive elements (UCSC Genome Browser, July 2003 release) and was compared against itself by use of PipMaker (BLASTz). The alignments are shown as a dot plot and are plotted on the horizontal axis according to sequence. Alignments—that is, repeated regions—are shown as black lines on the dot plot. Directly repeated sequences are represented as a series of dots forming upward-facing diagonal lines (/), and inverted repeated sequences are represented as a series of dots forming downward-sloping diagonal lines (\). The checkerboard-like pattern proximal to PLP1 represents numerous short, locally repeated sequences. The densely packed lines distal to PLP1 represent a large region of LCRs (further characterized in fig. 7B). There was one small region of similarity to the LCR region found proximal to PLP1 (104 bp with 73.08% identity) (oval). Other small regions of similarity on either side of PLP1 are shown by triangles, squares, and circles (described further in table 4). The approximate locations of the chromosome bands in the region are shown underneath the dot plot, and the position of PLP1 is indicated by a black box. B, Organization of LCRs distal to PLP1. The positions of the various repeat elements are shown relative to genomic clones in the region. LCR-PMDC and LCR-PMDD are novel, and LCR-PMDA and LCR-PMDB (including Ala, A2, A3, and Alb) have been described elsewhere (Inoue et al. 2002). In addition, two small inverted repeats were found in clone Z70273 (277 and 332 bp in size), and another was found in AL390022 (356 bp). Arrows show the direction of each repeat, and the scale bar shows their position on the X chromosome according to Ensembl.

