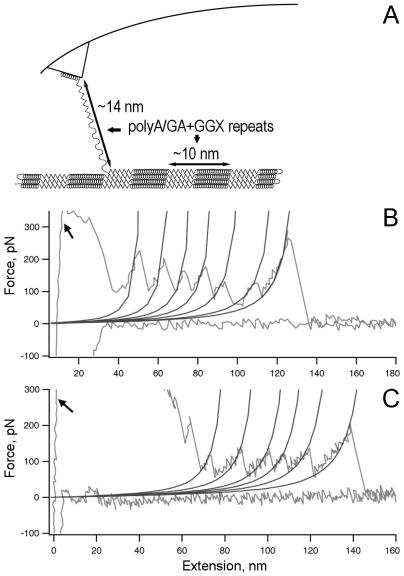
Figure 3.
Single-molecule force spectroscopy for pS(4+1) silk protein molecules. (A) Diagram of experimental setup, in which rupture peaks are believed to stretch one or more poly(A/GA+GGX) repeating units. (B and C) Force spectra (force-vs.-extension curves) for the unfolding of single molecules of pS(4+1) silk protein. The WLC model curves are fitted to each rupture force peak. The persistence length for each fit is 0.4 nm. Arrows indicate high-force rupture events at the beginning of the pulls, most likely because of multiple protein molecules attached to the tip of the AFM probe.

