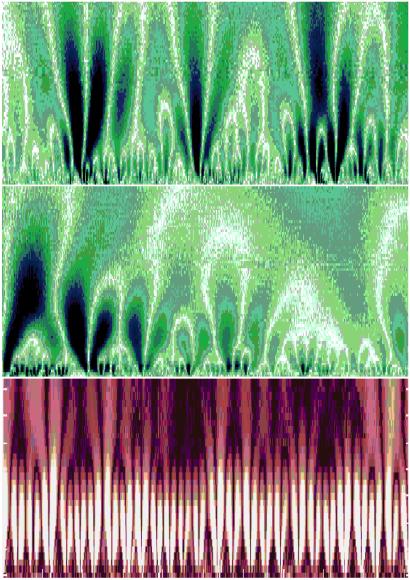
Fig 3.
(Top) Color-coded wavelet analysis of a heart rate time series in health. The x axis represents time (≈1700 beats), and the y axis indicates the wavelet scale, extending from about 5 to 300 s, with large time scales at the top. The brighter colors indicate larger values of the wavelet amplitudes, corresponding to large heartbeat fluctuations. White tracks represent the wavelet transform maxima lines—the structure of these maxima lines shows the evolution of the heartbeat fluctuations with scale and time. This wavelet decomposition reveals a tree-like, self-similar hierarchy to the healthy cardiac dynamics. (Middle) Magnification of the central portion of the top panel, with 200 beats on the x axis and wavelet scale corresponding to about 5 to 75 s on the y axis, shows similar branching patterns. (Bottom) In contrast, wavelet decomposition of heartbeat intervals (≈1500 beats) from a patient with obstructive sleep apnea, a common pathologic condition, shows the loss of complex, multiscale hierarchy, with emergent, single-scale (periodic) behavior. The wavelet scale (along the y axis) extends from about 5 to 200 s. The red background is used to provide contrast with the fractal cascades under healthy conditions, shown in the Upper panels. Adapted from ref. 24.

