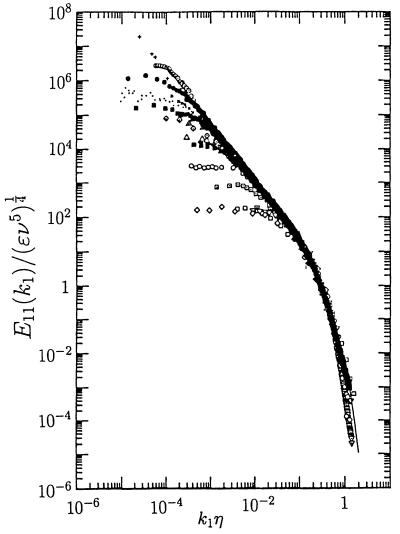
Fig 4.
The turbulence spectrum measured in many different flows. As the Reynolds number increases, the width of the spectrum increases, as the large scales are separated further from the small scales. At high Reynolds number, Kolmogorov (10) predicts a slope of −5/3, which is seen in these measurements. [Reproduced with permission from ref. 11 (Copyright 1994, Cambridge University Press).]

