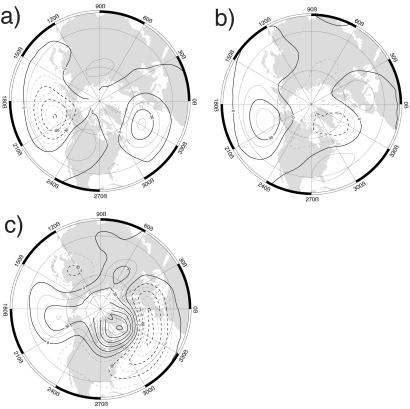
Fig 1.
Hemispheric regimes: anomaly maps of 700-hPa heights for the three cluster centroids identified by a Gaussian mixture model. (a) PNA. (b) Reverse PNA (RNA). (c) Blocked-NAO. Contour interval: 15 m. [Reproduced with permission from ref. 29 (Copyright 1999, American Meteorological Society).]

