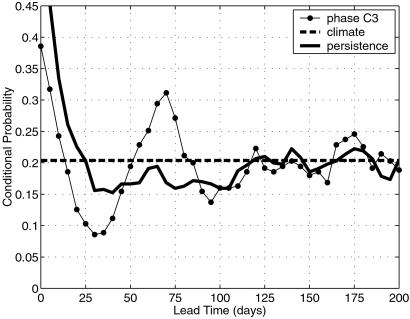
Fig 5.
Enhanced regime predictability: conditional probability of occurrence of the SH low-latitude regime events, taking the phase category of the SH 70-day oscillation as a predictor (thin solid curve with filled circles), as a function of lead time. The heavy horizontal dashed line indicates climatological probability, and the heavy solid curve denotes the persistence forecast. [Reproduced with permission from ref. 18 (Copyright 2001).]

