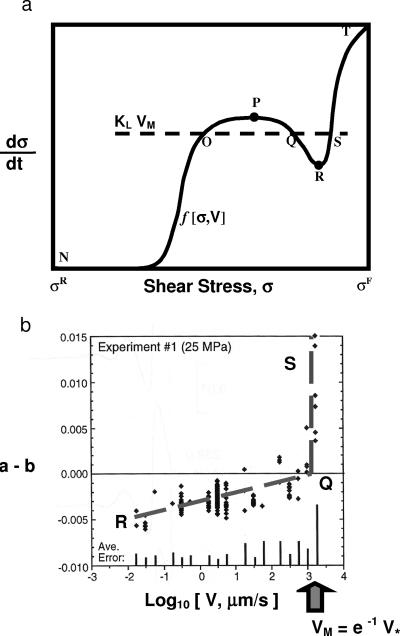
Fig 2.
(a) Schematic plot of the stress dissipation function f(σ, V) as a function of σ. Location of spinodals is indicated by filled circles. Maxwell velocity VM (dashed horizontal line) corresponds to the stress supply rate KLVM at which the Area(OPQ) = Area(QRS). (b) Plot of a–b vs. Log 10(V), where (a–b) = (A–B)/(normal stress). Data (diamonds) is from figure 5 of ref. 30, an experiment where the normal stress = 25 MPa. Dashed line labeled RQ is from Eq. 28 and corresponds to the path RQ in a. Dashed line labeled QS corresponds to the jump QS to the stable branch ST of a.

