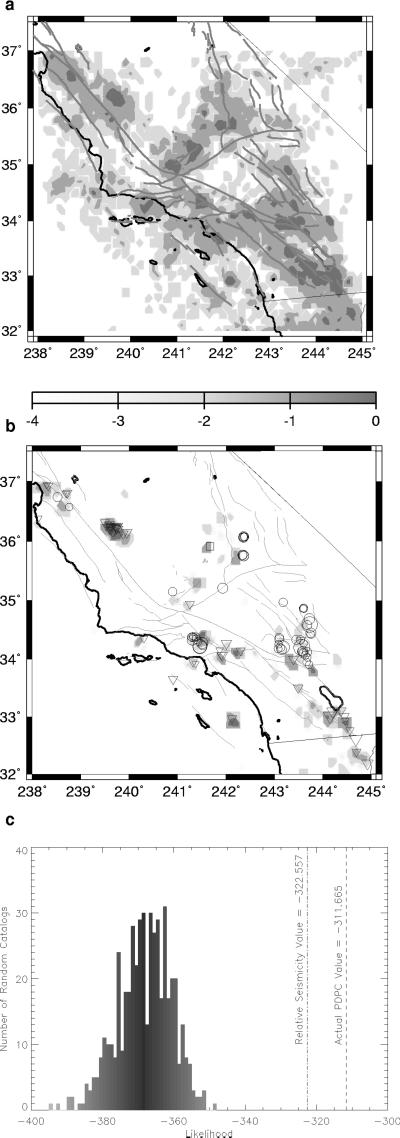
Fig 3.
(a) Relative seismic intensity in southern California for the period 1932–December 31, 1991, plotted with linear shading scale. (b) Shaded-contour plot of Log10ΔP(xi, t1, t2), for locations at which ΔP(xi, t1, t2) > 0. Times t1 = January 1, 1978, and t2 = December 31, 1991. Values are scaled by the maximum and shading scale is linear. Inverted triangles are events that occurred from 1978 to 1991 with 5 < m < 6 (smallest triangles); 6 < m < 7 (intermediate triangles); 7 < m (largest triangles). Circles are events that occurred from 1992 to the present, with 5 < m < 6 (smallest circles); 6 < m < 7 (intermediate circles); 7 < m (largest circles). (c) Log10(ℒ) plots for 500 random catalogs (histogram), for the seismic intensity map of a (dash–dot line), and for the forecast in b (dashed line). All three methods were scored by the Likelihood test according to how well they forecast the events of magnitude m > 6 that occurred on or after January 1, 1992 (circles).

