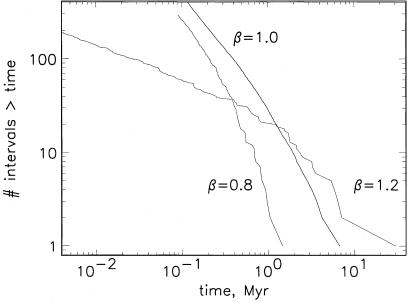
Fig 12.
Cumulative frequency-length polarity interval distributions for the 1/f noise model of intensity variations (shown in the middle, also given in Fig. 5) and for intensity variations with power spectra proportional to f−0.8 and f−1.2. This plot illustrates that the polarity length distribution is very sensitive to the form of the power spectrum, allowing us to conclude that the agreement between the model and the observed distribution is unique to 1/f noise intensity variations.

